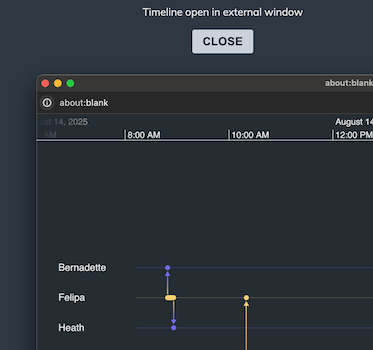
Product update: open KronoGraph in a new window
Bonney O'Hanlon Product Manager
16th April, 2024 | 2 min read
When analysts and investigators use apps built with our toolkits, we aim to give them the best user experience. In...
Bonney O'Hanlon Product Manager
16th April, 2024 | 2 min read
When analysts and investigators use apps built with our toolkits, we aim to give them the best user experience. In...

Catherine Kearns Content Strategist & Team Lead
11th April, 2024 | 7 min read
This blog post investigates misinformation and disinformation – what it is, why it’s harmful, and what’s...

Gemma Fitzjohn Head of People and Culture
8th March, 2024 | 4 min read
International Women’s Day (IWD) is a time to reflect on how we support women both within our business and our...
Bonney O'Hanlon Product Manager
7th March, 2024 | 2 min read
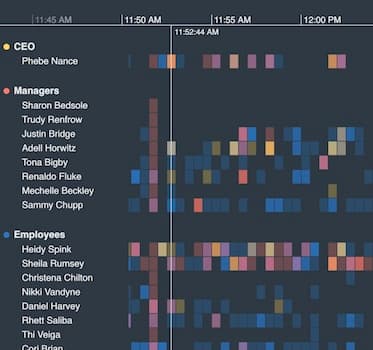
The latest version of KronoGraph, our timeline visualization toolkit, makes it easier to reveal detailed timings...
Courtney Collins Product Manager
5th March, 2024 | 2 min read
The latest versions of KeyLines and ReGraph, our graph visualization SDKs, include two hotly-anticipated...

Catherine Kearns Content Strategist & Team Lead
20th February, 2024 | 8 min read
There’s a lot more to credit card fraud visualization than just spotting disputed transactions. To be effective,...
Dan Williams Head of Product Management
15th February, 2024 | 8 min read
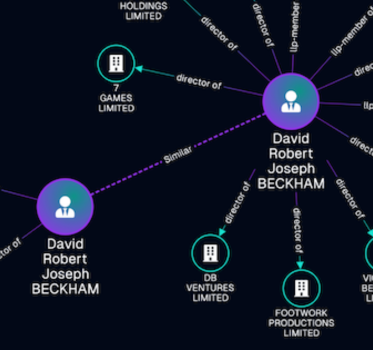
Find out how to use data visualization for compliance, putting analysts in control of their due diligence...

Dan Williams Head of Product Management
12th February, 2024 | 2 min read
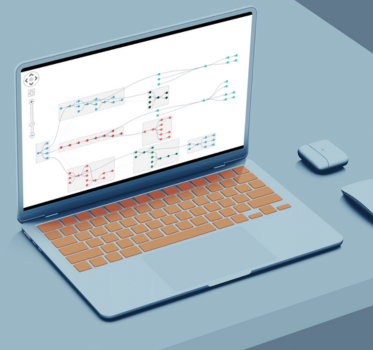
Despite big advancements over the past decade, graph and timeline visualization is not a solved challenge. New use...

Rosy Hunt Content Marketing Specialist
8th February, 2024 | 5 min read
Software developer Khadeja reflects on her favorite projects at Cambridge Intelligence. We’re so proud that...