The law enforcement data challenge
Modern law enforcement relies on good data insight.
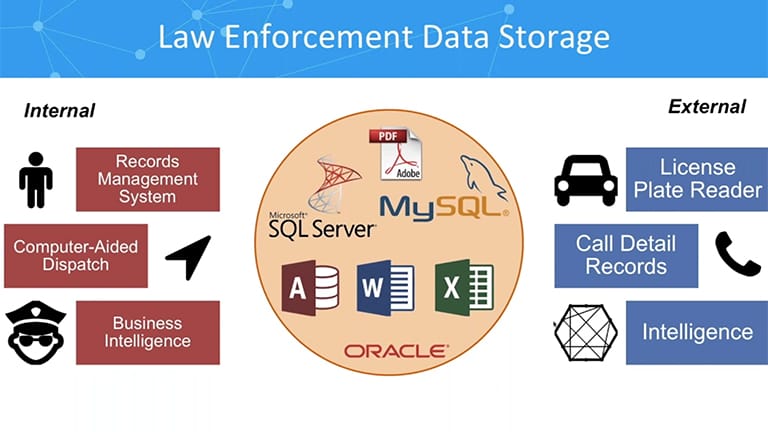
From national information centers and call data records to operational intelligence and case histories, the police have access to a lot of data. The problem is they lack the tools to understand it.
They’re limited by overwhelming data volumes, organizational silos, and a shortage of trained data analysts. The result? Critical connections are missed, and opportunities to detect, solve and prevent crime are lost.
Data visualization, especially link analysis and timeline visualization, helps law enforcement join the dots in their data and make better decisions, faster.
Let’s see how.
Joined-up investigations
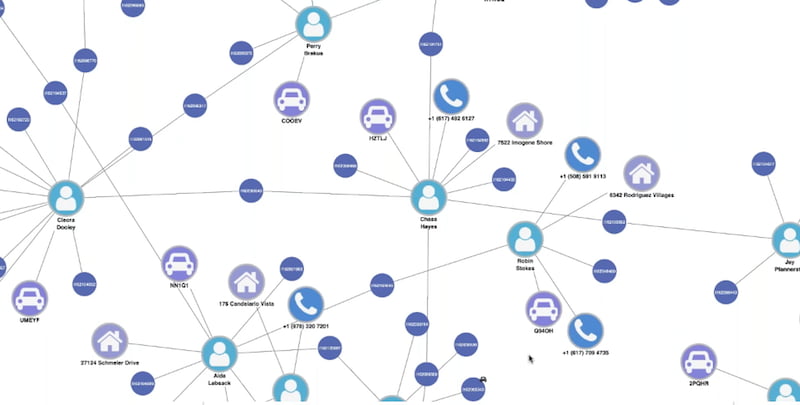
Law enforcement investigations are about finding and proving connections between suspects, events, and crimes. Increasingly, that relies on retrieving and understanding data. From call data records to open source intelligence, investigators need to transform raw data into useful and shareable intelligence.
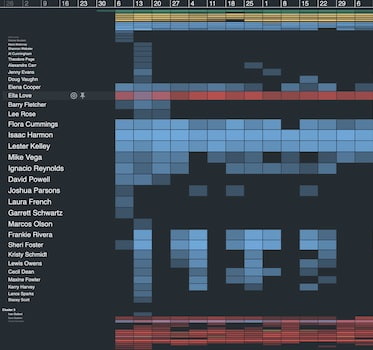
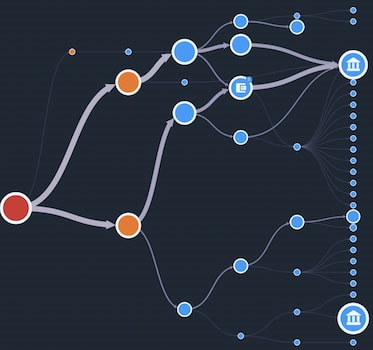
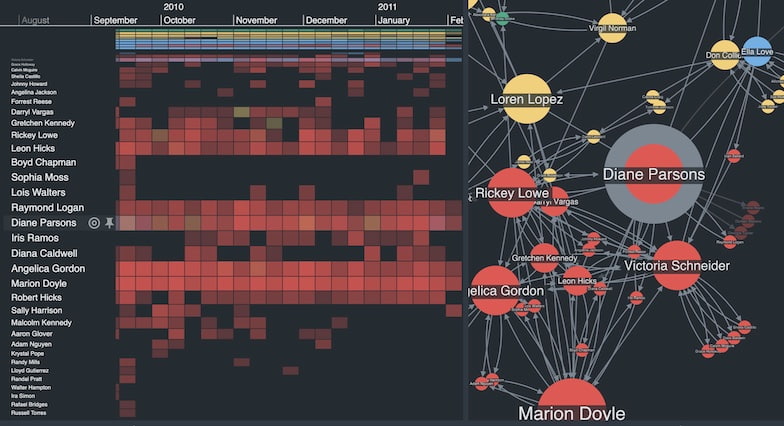
Link analysis combined with timeline visualization, investigators quickly see patterns of relationships as they develop.
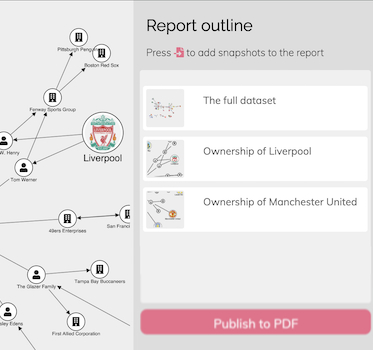
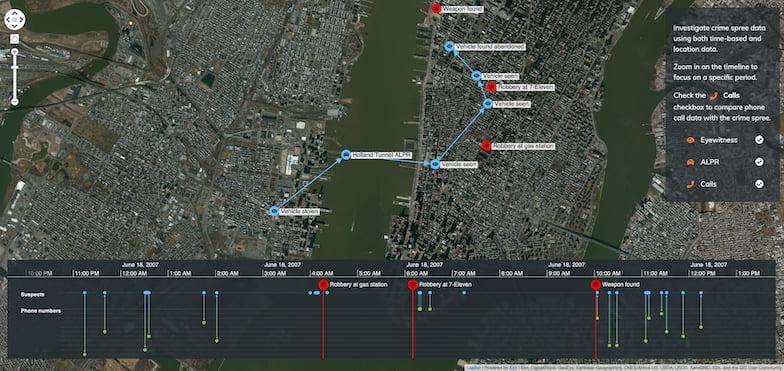
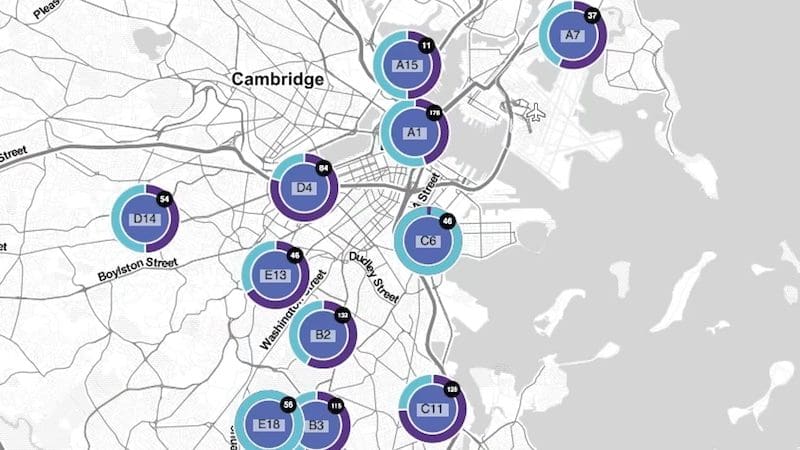
Most crime has a geospatial dimension too. Seeing connected incidents on a map brings clarity to complex situations, and makes it easy to share insight with colleagues or in court.
Learn more in our white paper
See how our data visualization toolkits help law enforcement agencies power better investigations, incident response and resource deployment.
Detect crime and identify trends
To spot criminal behavior, police need to identify patterns and anomalies. Whether that’s analyzing a target’s movements, communications or financial transactions, the human brain has a unique ability to recognize patterns.
Link analysis software gives law enforcement a way to give a simple, visual representation of complex scenarios, making it easier to answer the who, what, where and when questions hidden in data.
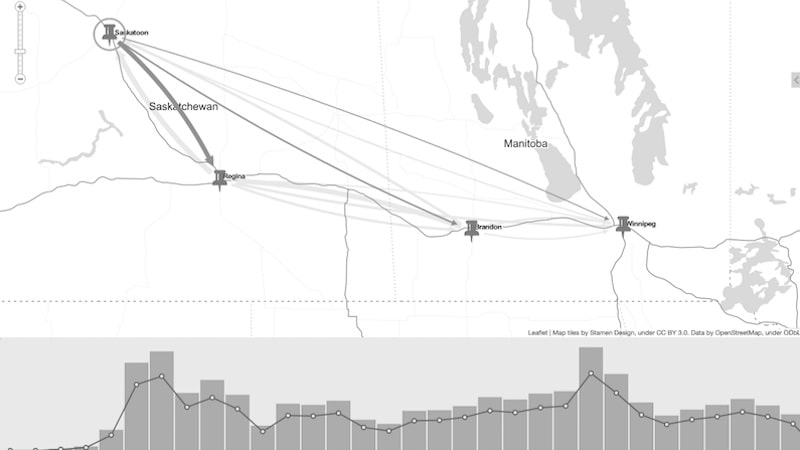
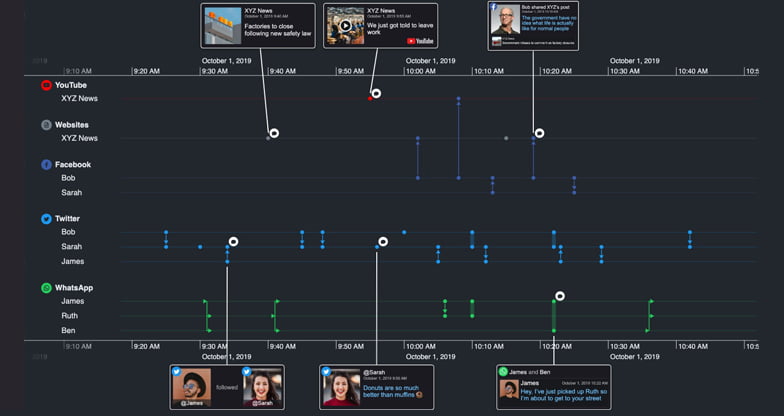
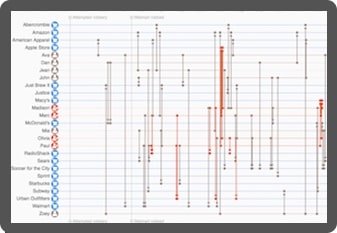
Timeline visualization reveals relationships between events, showing cause and effect and highlighting time patterns that wouldn’t otherwise be visible.
Shared awareness across the organization
Intelligence and insight are most useful when it’s shared. Intuitive and interactive data visualization tools make that insight easy to understand, helping officers collaborate and make the best decisions in fast-changing, high-stakes scenarios.
In contact centers, call handlers must make split-second judgments. Based on the best available information, they dispatch colleagues into potentially dangerous scenarios. Link analysis provides real-time contextual information to identify threats, risks, and harm to officers or the public.
At a senior level, law enforcement commanders and leaders need high-level visibility, whether of aggregated crime data, or situational awareness during on-going incidents.
Custom timeline visualization and link analysis for law enforcement
We’ve worked with law enforcement worldwide to create the next generation of data visualization platforms.
Using our link analysis and timeline visualization technologies, they’ve built interactive applications that join the dots and reveal the data insight officers and investigators need to understand.

Overcome data silos
Bring together data from across the organization into a single chart. Our flexible approach means you see the full picture and gain insight from multiple data sources.

Remove the analysis bottleneck
Intuitive visualization tools are custom built for your users and the data they need to understand. No more analysis bottlenecks in the investigation workflow.

Get answers faster
Discover new dimensions to your data that aggregated methods can’t show. Timeline and link analysis techniques lead to faster decisions and fewer missed threats.
Shared insight, everywhere for all
Data insight is more powerful when it’s shared. Interactive data visualization tools make it easy for every user to access and understand complex data.
Want to try it for yourself?
KeyLines
Graph visualization for JavaScript developers
Code how you like and build link analysis apps that work with any stack.
ReGraph
Graph visualization for React developers
Use a simple data-driven API to build customized graph visualization apps in React.
KronoGraph
Timeline visualization for JavaScript or React developers
Design interactive timelines to explore patterns and unfolding events.