Some of the world’s largest organizations have placed IP at the heart of their business strategy.
Understanding your IP and the IP of your competitors is key insight, driving everything from R&D and product management to competitor landscaping, acquisition plans and even staff recruitment. Often, IP is held in the more tangible form of patents.
The complexity of patents
Keeping track of patents is far from a simple task. In 2012, the number of patents increased by 9.2%, bringing the number of patents in force at the 100s of patent offices worldwide to 8.66 million.
Then there’s the complexity of modern patents (and their lengthy descriptions) themselves. Many patent authorities simply lack the number of qualified investigators needed to work through the volume of applications made.
In 2012, the US Patent and Trademark Office approved 90% of all applications, with some concluding that investigators were just making cursory searches before approval and leaving assignees to fight it out in court afterwards.
With all this conflict, confusion and corporate money in the air, we can see how IP has become a goldmine for lawyers and ‘patent assertion entities’ (patent trolls to the rest of us).
Simplifying patents with networks
In this blog post, we’re going to look at how we can help companies simplify patent data using a network-based approach. Understanding patents is a matter of understanding connections – especially those between inventors, assignees, classifications and the patents themselves:
- An inventor is normally the person principally responsible for the innovation being patented
- An assignee is the owner of a patent; often the organization for which the inventor was working at the time the patent application was filed
- A classification is the category into which the patent was filed, usually according to the technical features of the innovation.

Mapping this data as a connected network provides valuable insight into which individuals and organizations are present in which areas, and which areas are under-controlled.
Using an API to the EPO database, we’ve put together a KeyLines demo visualizing some patent data…
The ‘Big Pharma’ patent war
Two companies that have been getting a lot of attention in the UK and US are pharma giants Pfizer and Astra Zeneca.
Pfizer’s recent $119bn takeover attempt may have been driven by significant tax benefits, but the company also were surely motivated by an impressive patent portfolio… In an environment where a single drug can cost $4bn to develop (and create over $100bn in revenue), it’s important understand the IP landscape.
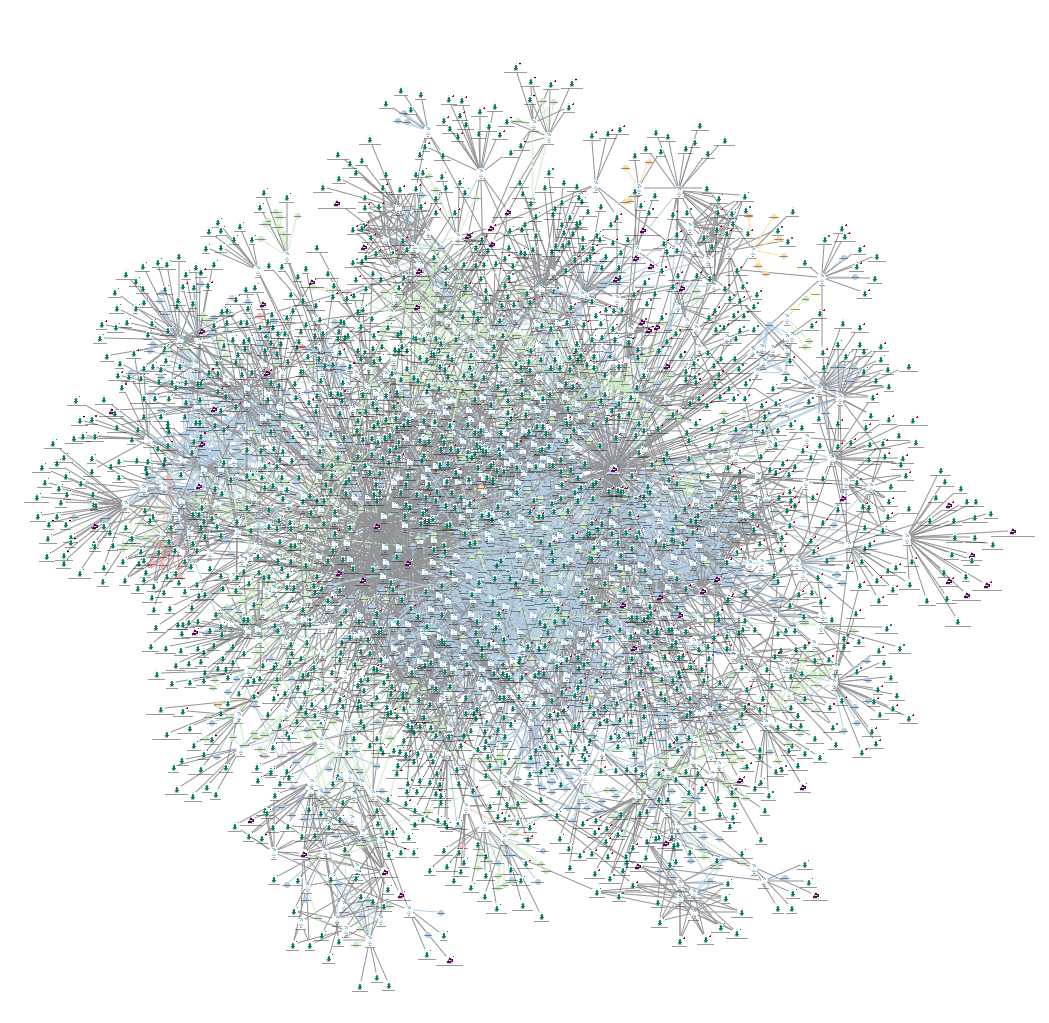
Here’s a network of the last 600 patents registered by the EPO with Pfizer or Astra Zeneca as the assignee. It’s a bit of a tangle at first:
But when we look at connections between assignees and classifications (color coded by category) a much more coherent picture emerges:
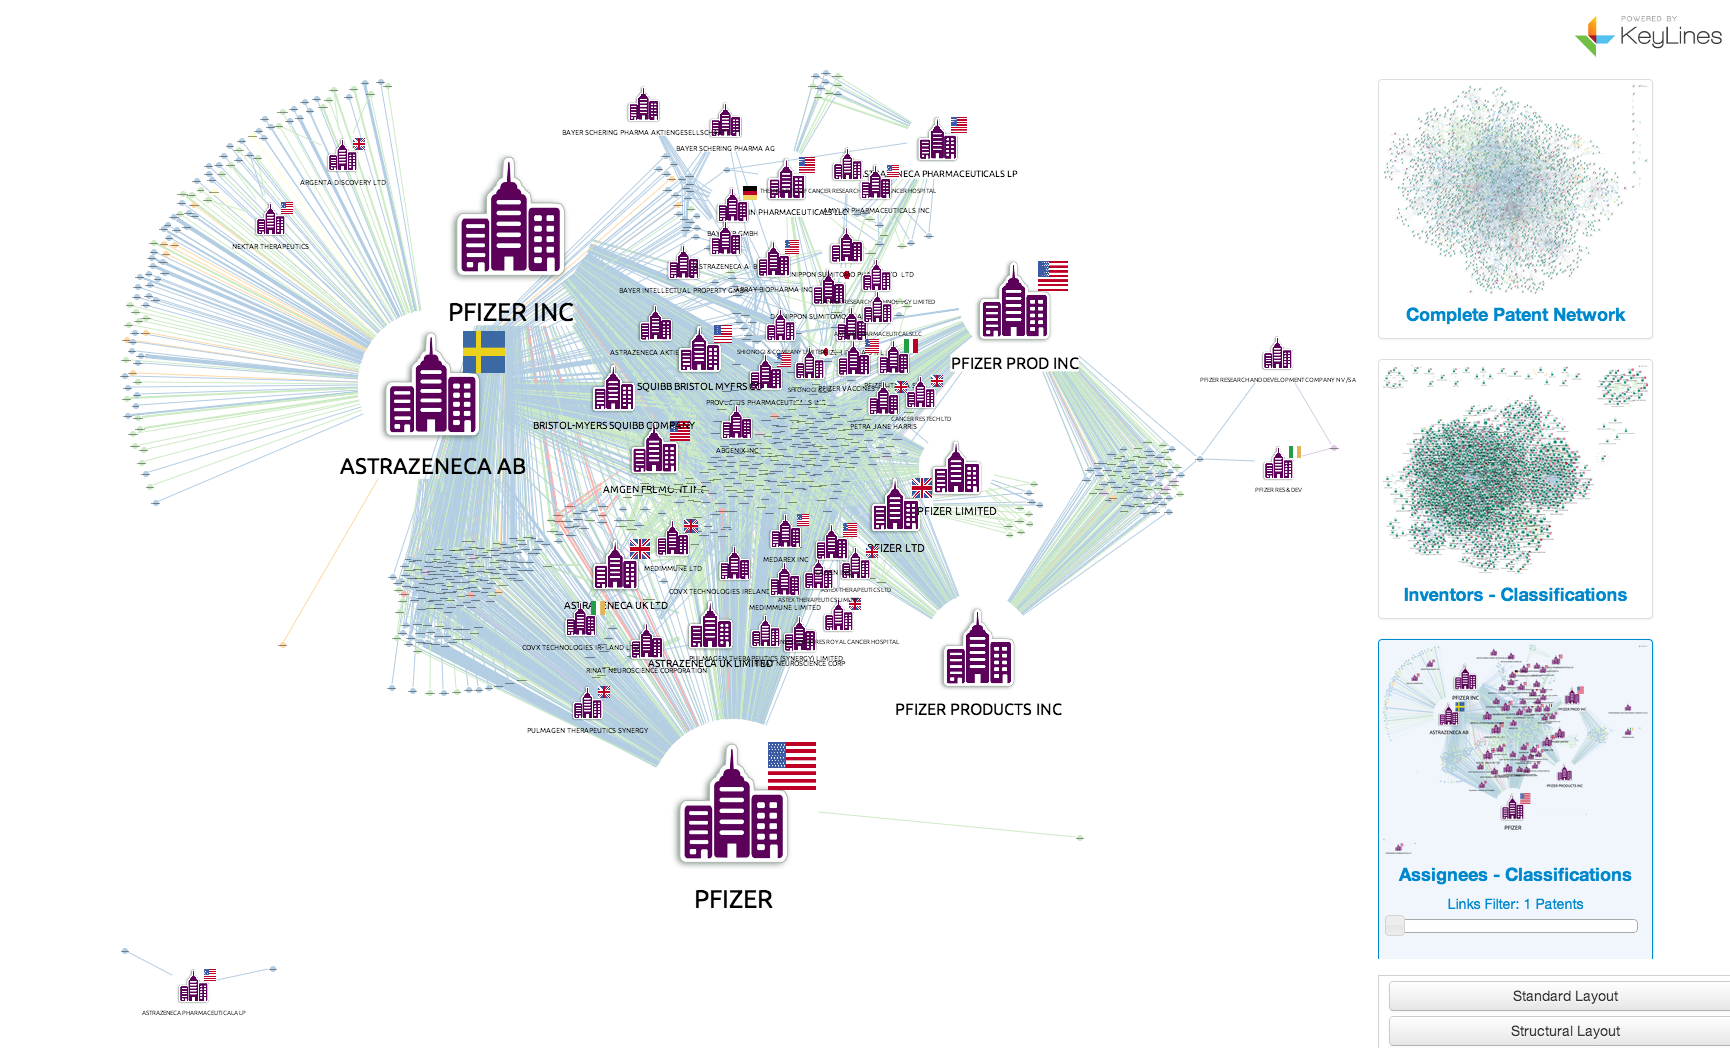
We can see by the huge number of ‘shared’ category nodes between the different assignees that the two companies compete directly in core areas. For Pfizer, buying that competitor, plus their vast portfolio of relevant patents, would be significant advantage.
Further, in the top-left we can see a fan of categories AZ in which Pfizer have not recently registered patents. This could indicate unique strengths in AZ’s R&D program from which Pfizer could benefit.
Google X: Buying good inventors
Another motivation for understanding the patent landscape is to identify the industry experts. An example of a company doing this is Google.
For the past 4 years, a semi-secret department of Google (the futuristic sounding ‘Google X’) has been acquiring promising tech companies and subsuming their tech into Google’s product portfolio.
As many of the companies are young and small, it’s probably fair to say the employees’ expertise & patents were of more interest than the companies’ revenue.
Let’s take a look at a few of the latest acquisitions and registered inventors:
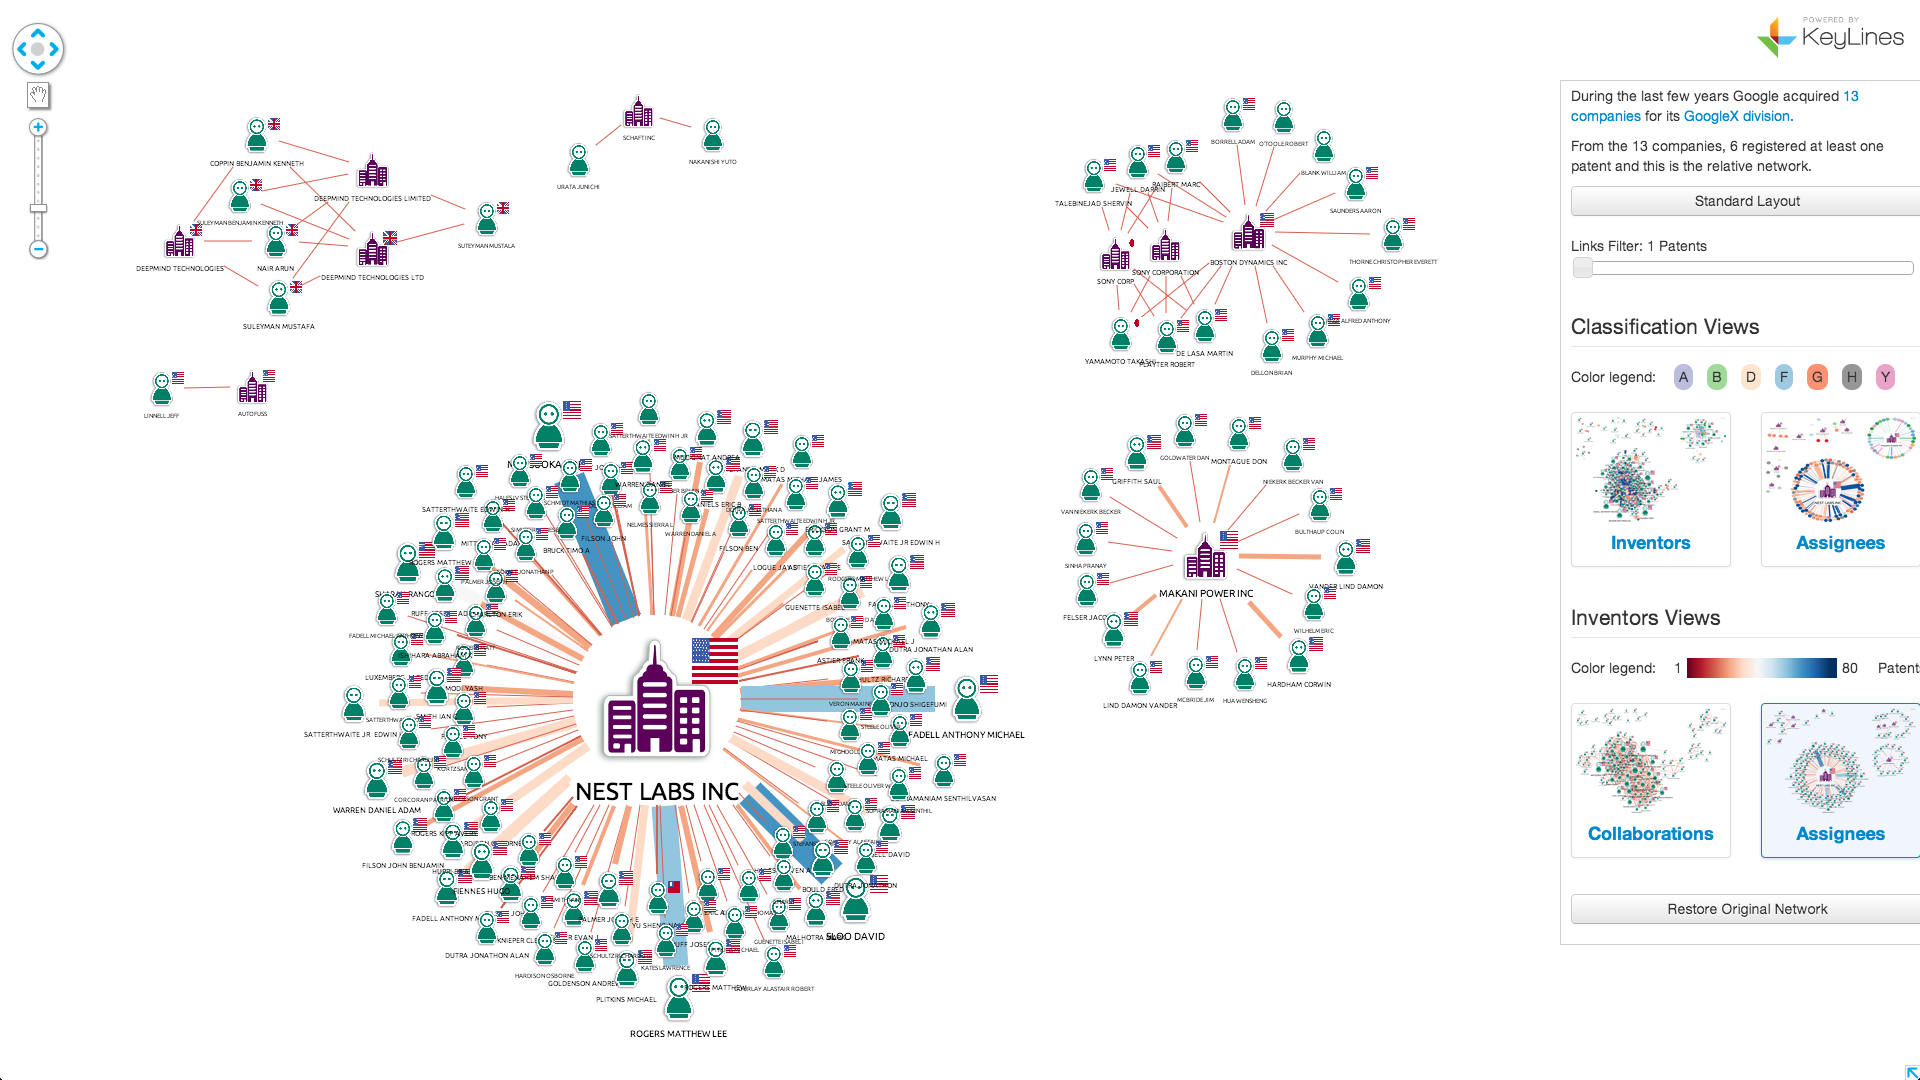
Both the inventor nodes and links are sized by number of patents registered at the EPO.
Nest appears to be a good acquisition choice. The company includes a large number of inventors, including 4 serial inventors – identifiable by the significantly heavier links. Their patents also span at least 5 different categories.
Likewise, Mankani Power (in the lower right-hand side) has a good number of inventors working across several areas.
Boston Dynamics in the top left, seem to have patents focused in one single area, but have collaborated with Sony Corporation. For the rest, on paper, they seem less exciting with only a few inventors between them – all in the same category.
Visualize your own patent networks
Visualizing patent data in this way gives instant access to meaningful, useful information.
If you would like to see a full working demo of KeyLines, get in touch


