Graph analytics to manage your supply chain network
Modern supply chains are expansive, complex networks involving many moving parts. Managing these networks can be challenging but with the help of graph analytics, it doesn’t need to be.
By the end of this session you’ll understand why supply chain visualization and graph analytics are essential to understanding and managing your network.
Supply Chain Visualization Webinar Transcript
Prefer a written version? We’ve transcribed the webinar for you
We’re excited to talk to you today about supply chain visualization. We’ll look at case studies for supply chain, focusing on how graph visualization and analytics can assist with managing processes with lots of pieces and moving parts.


I’m Christian Miles – I help Cambridge Intelligence customers in North America get familiarized with graph visualization and applying our product, KeyLines, to a wealth of different domains. You’ll also hear from Dan Williams later – he’s Head of Product Management, and controls the roadmap for future releases. Dan has a wealth of experience across a number of different verticals, so it’s great to be talking with him today.
I’ll be walking through why you would want to visualize supply chain as a graph, then we’ll move to a case study from Dan focusing on manufacturing and the risk models associated with manufacturing. And then it’s back to me for an inventory monitoring use case focusing on liquor store data from here in Canada. And then we’ll have time for Q&A, so feel free to submit questions throughout the talk.
About Cambridge Intelligence
At Cambridge Intelligence, we help our customers visualize and analyze connected data. Now connected data can take many forms. Whether it’s the communication channels between terrorist cells, or entities involved in cybersecurity attacks, and the inception of those attacks, or even tracking shipments as they travel between manufacturers and wholesalers in a supply chain.
We have over 200 customers worldwide, and they work in a number of different domains. One of our products, KeyLines, is a JavaScript library, and it helps uncover and highlight parts of data that may otherwise have been overlooked. Today, we’re focusing on supply chain management.
The ultimate guide to graph visualization
Everything you need to start designing your best graph visualization application.
Why visualize your supply chain?
Here’s a quote to kick off our discussion:
“The supply chain stuff is really tricky.”
SpaceX and Tesla are just two high profile examples of supply chains in action, in this case for electric vehicles and rockets. But really, all companies have some sort of supply chain, whether they are part of the supply chain themselves, or they’re taking advantage of the supply chain to get their goods to their customers.
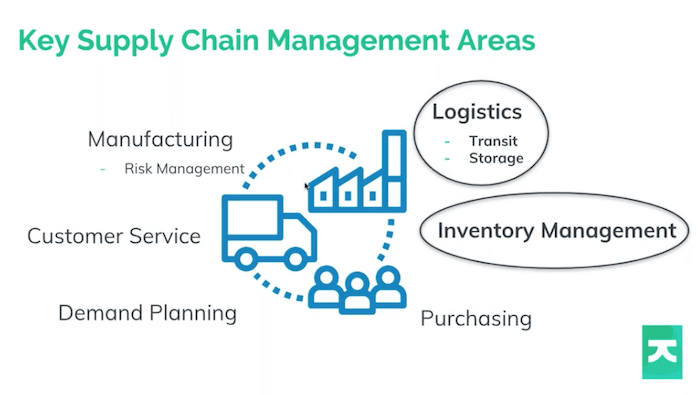
In reality, there are a lot of different things we can mean when we refer to supply chain management. Dan will drill into manufacturing and risk management today, and I’ll focus on logistics and inventory management.
Each of these different components has its own graph model to them. And when we talk about graphs and connected data, we’re talking about entities that are connected inside a supply chain, or whatever your dataset is. And those models can be shifted and adapted as per requirements for your company. But if we’re thinking about how we would start to visualize that supply chain, regardless of which area we’re referring to, maybe it’s nice to start off with a really basic picture of what we mean by supply chain and how to visualize it.
[Read our case study on Connected supply chains: the Illunex platform]
The supply chain visualization graph model
I wasn’t joking! Here is a very basic graph with two nodes and one link.
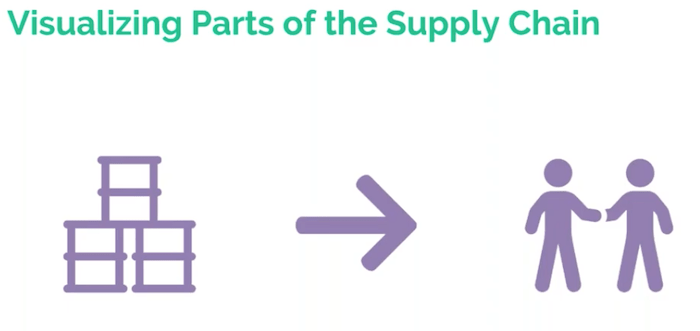
But here we are talking about a supply chain that is the movement and storage of raw intermediate materials from the raw state into customers, hands or consumers hands. We have oil drums representing raw materials on the left. But in reality, these raw materials could be education or knowledge: really, they could be taking any form.
In many ways, you can keep going left on this sort of diagram, and keep coming across more and more raw materials that you’re working with. Now, we can make this diagram a little bit more complicated when we consider how supply chains actually work.
Supply chains are bi-directional. You may not think this, but in reality, if you’re delivering something to a customer, they are going to be in turn feeding things back down the supply chain. Whether that’s money or information, just those can be considered as part of the supply chain. One really high profile example is liquidation or used goods that are being sent back or returned to customers. There’s a company that sold $626 million worth of Amazon returns last year. That ‘reverse’ supply chain is called can often be an important thing to consider.
As ever, the devil’s in the detail, so arrows really represent a whole host of different actual entities that are part of the supply chain.
Whether it’s the suppliers of the original source materials, the manufacturers that put pieces together (similar to the assembly line), or the final mile getting the product to the customer through distributors, wholesalers and the customer themselves.
An example distribution network
If we think about using KeyLines and using supply chain visualization, we’re more likely to have a model that looks a little bit more like this.
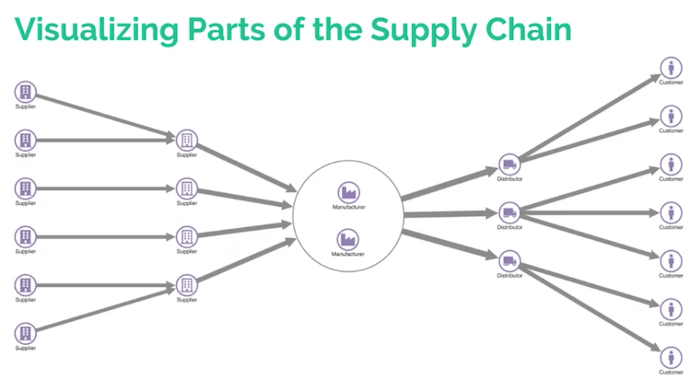
This is a static image of a KeyLines chart and our first view of KeyLines today. You can see that it’s kind of broadly the same as the diagram I gave you just before. On the far left, we have suppliers and on the far right, we have customers, but now we start to get an idea of the model that underpins that supply chain.
There are a few things to note here. Firstly, we have two tiers of suppliers with the first tier feeding into the second tier. This is a dummy example because really we’d have hundreds or maybe thousands of different suppliers for large companies or large goods. In the middle we’ve used a combo to represent the fact that these two manufacturers are actually in distinct, separate locations but they’re combined in some way. That could be ownership by the parent company, or through working together to produce two components of the same product. For a supply chain for building planes, for example, the top manufacturer could be assembling or manufacturing the fuselage, whereas the bottom could be manufacturing the wings.
The distributors are represented by the little truck icon. We can see that they can disperse the product to the customers based on region, or some other factor. And again, this is a basic example because in reality, the distributor network is probably more complex and complicated. Now I’ll hand over to Dan to talk through our first case study today.
Supply chain visualization: manufacturing case study
Before I joined Cambridge Intelligence, I spent many years working on engineering software for the manufacturing industry. One of the problems I was preoccupied with was the issue of restricted substances in the supply chain. I’m going to show you what the problem is, and how supply chain visualization and graph databases could help, particularly with avoiding risk in that situation.
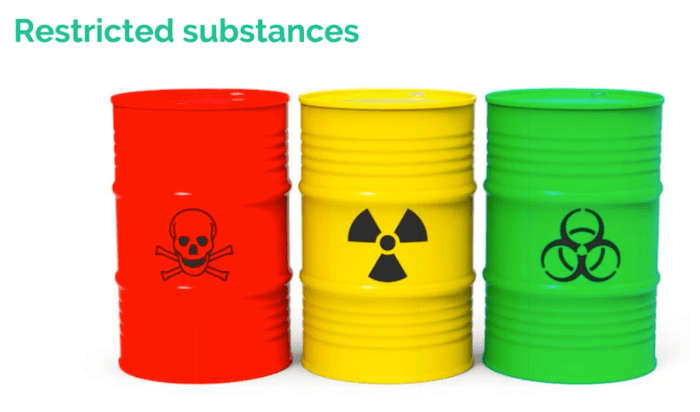
When you think of restricted substances, you probably think of brightly-labelled, foul-smelling evil things that are very easy to spot from a mile away. In reality, there are lots of restricted substances, many of them very, very subtle indeed. In everyday household plastics, there could be all manner of different flame retardants, or plasticizers, that are used in production. And those chemicals themselves may be restricted or banned in some way.
Sometimes these things become very high profile. Some years back, there was a scandal involving baby bottles. Baby bottles are made out of plastic or polycarbonate. Polycarbonate is a plastic: you don’t mine plastics out of the ground, you have to make them with recipes. One of the ingredients in polycarbonate turned out to be nasty for health. And so there was an interesting scandal and people worried about what their baby bottles were made out of, even if there was no trace of the initial chemical left in the final product.
The challenges of tracing individual components
People can get very concerned about these things if they become a news story. And sometimes the restricted substances aren’t in the product, they were just involved in its manufacturer in some other way. Brightly-colored bike pedals may be colored using an anodizing process. That process involves the use of some chemicals, but they never make it into the final product. They’re just part of the process. Nonetheless, if that process is in your supply chain, then those chemicals are being bought by one of your suppliers. There are things that you need to be aware of.
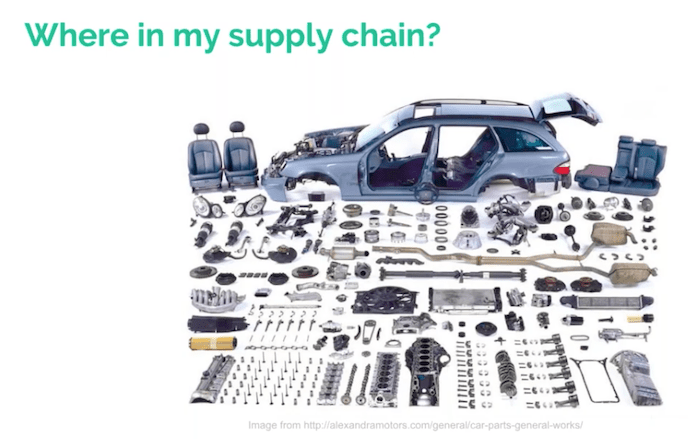
If you’re a car manufacturer, those cars contain around 30,000 parts, so this gets very complicated indeed. If you can imagine a particular ingredient being used to make the plastic which is used in one of the wires, which is used in a wiring harness, which attaches the radio to your car, then you realize that you have a very big supply chain and a lot of difficult questions to figure out if any chemicals are in that supply chain. How many chemicals make up a car? I don’t think anyone could tell you the answer to that. It is a very, very difficult problem.
Nonetheless, there are legislations out there which tell you that you’ve got to do something about this problem. One very prevalent, influential piece of legislation is on the Registration, Evaluation, Authorization and Restriction of Chemicals (REACH). It’s European legislation, but because supply chains these days are global, it has worldwide impact. And this legislation is constantly adding new substances. If you use any of those substances in your supply chain, there are obligations to report them. Your suppliers need to tell you if they use them, and you need to tell your customers that you use them. It’s an ever-changing landscape of difficult reporting obligations.
What on earth can you do about this? I’m going to try and show you why this could be a graph problem.
Visualizing European Chemicals Agency data
The first thing I did was go to the European Chemicals Agency website and downloaded the spreadsheet of that candidate list. There’re about 200 substances on it. And I plumbed it into KeyLines, just to see what it would look like.
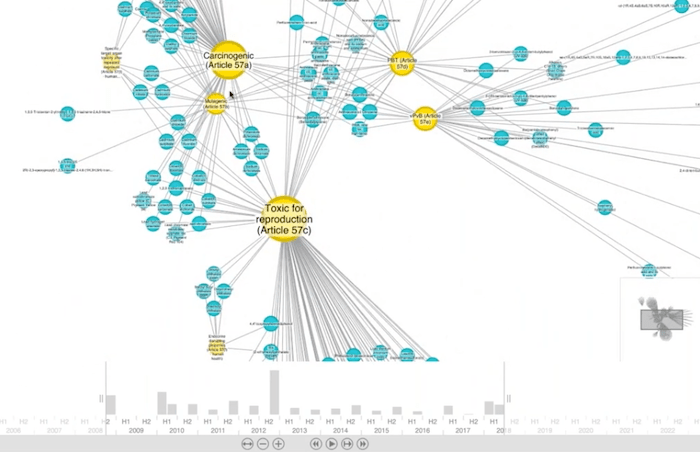
Each of the blue nodes represents a chemical (you’ve almost certainly never heard of most of these chemicals). They’re linked to the reason that these chemicals are included in the legislation. So you can see that they are indeed pretty nasty things. And you can see the kinds of things that this legislation is protecting us from, which is already good.
Every one of these links has a timestamp associated with it. If we were to look back to the early days of this legislation, there weren’t that many chemicals and it might have looked like a tractable problem. But over the years, as we zoom out in time, you realize that more and more chemicals are getting added until you see the 200 that are being added today.
KeyLines gives us the most fun way of visualizing the growth in this legislation over time, and might help us understand the landscape that we’re faced with.
That was just for fun. When you actually start applying this, in principle, it gets pretty tough. Even if you were up to date with the legislation, you understood the chemicals, you focused on one and you figured out that this was used to make orange or yellow dyes, which could be used in your products. If you were a manufacturer of an orange product, how do you know if you’ve got that chemical somewhere in your supply chain?
Making sense of your supply chain visualization
This is where the graph comes in. Here’s a model we might use to understand this problem as a graph. A graph is nodes and links.
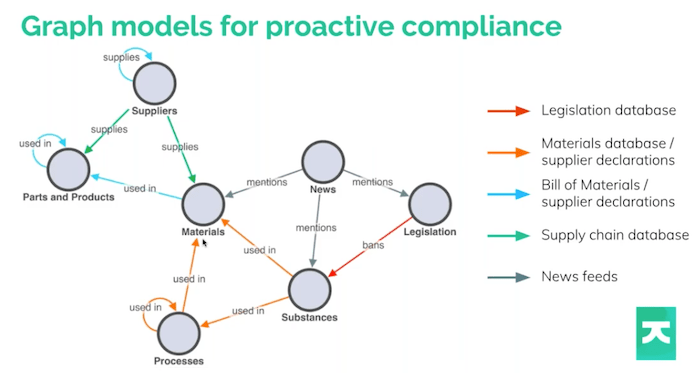
We might start on the left with parts and products. A node can link back to itself, so parts can be linked to parts. The wire is in the harness, the harness is in the radio, the radio is in the car. Parts contain materials, materials are used in parts, the parts are used in products. And those substances are often either used in the material, or in the processes, which in turn, eventually make up the material.
The bottom left of this picture is what I’ve been talking about. On the top left of the picture, you have the supply chain itself, suppliers supplying these things and how the suppliers connect to each other. And then on the right, we’ve got legislation. The legislation probably bans particular substances. You might not even hear about it until you’ve read the news and it mentions a nasty chemical or a scandal involving baby bottles, and then you suddenly need to figure out: is this substance in any of my products?
The graph gives you a clue about how you might do that because everything is connected here. The power of graph databases and graph technology means that we can start to ask ourselves questions that traverse this graph. Where is this material used in my product line? Or what is the riskiest supplier in my supply chain, when I consider this new legislation?
Finding source data for your supply chain visualization
The first difficult challenge is to get hold of the data. The color of each arrow shows where this information probably resides. You might have a database of legislation or, like me, you went to the European Chemical Agency website and downloaded the spreadsheet. Companies are realizing they’ve got to figure this out. And the automotive industry has been doing this for many years. They have a system called the International Material Data System (IMDS), which captures all of this. If you’re a supplier to the automotive industry, you declare what’s in your parts. All of that information is shared up and down the supply chain, and it’s a really impressive database project.
If you’re in another industry, you may not have anything like that, so you’re going to have to find this stuff out. And because legislation like REACH is constantly adding new chemicals to the list, it’s no use asking your suppliers, “hey, does this contain cadmium chloride?” They might give you an answer, but even if they say no, you don’t know what else is in the product.
People are increasingly trying to get their suppliers to tell them everything. It’s called full material disclosure (FMD). They say, “tell me everything that’s in my product”. And if you can figure that information out, all the way down your supply chain, you’ve got a phenomenal amount of data that you can make use of. But it’s no easy feat.
Digging deeper into our supply chain visualization
Let’s, explore what can happen when that data is collected together from lots of different databases. The power of graph visualization is that once you’ve got it, you can build a graph, maybe transform that data into a graph format, and start to analyze it. Let’s have a look at how we might do that.
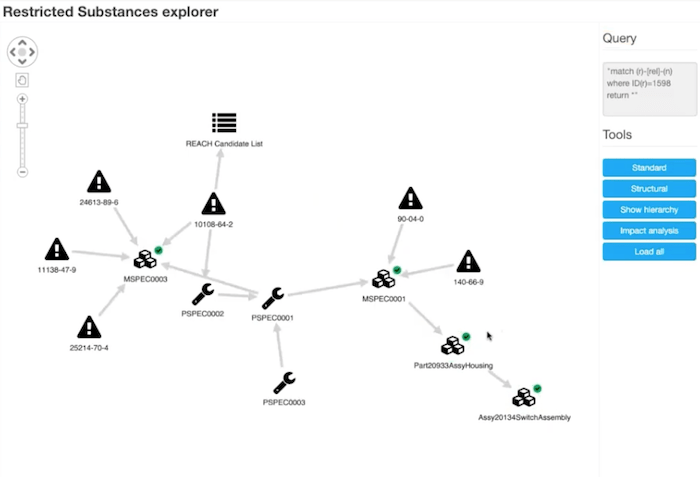
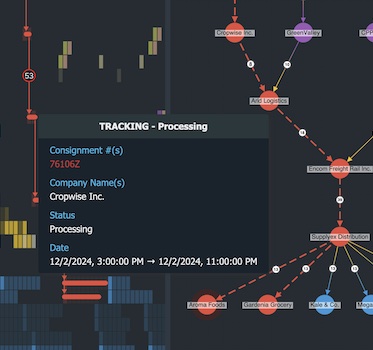
I set up a very simple example by creating a database with simple substances and materials. I’ve built a kind of mini version of that picture and loaded it into a Neo4j graph database, but you can use any graph database you like. I’ve written a very simple web front end, which queries my database, and lets me explore it using KeyLines.
I’m telling KeyLines to do things like show chemicals as little warning signs and pull out information from the database. I’m looking at cadmium chloride here and if I double-click it, I send a query out to the database and say, “what do we know about this material?” It’s telling me this substance is on the REACH candidate list. It’s one of these substances of high concern, and it’s telling me that I use it in one of my company material specifications, and in one of my company’s material process specifications.
Applying impact analysis to your supply chain visualization
I can carry on exploring and as I drill down through the list, I can see that this particular material has lots of other chemicals in it, and the process involved in its manufacture. And that process impacts other materials, and I can continue exploring around the database. The key thing here is that I’m figuring out what is the impact of this particular substance on my particular manufacturing supply chain.
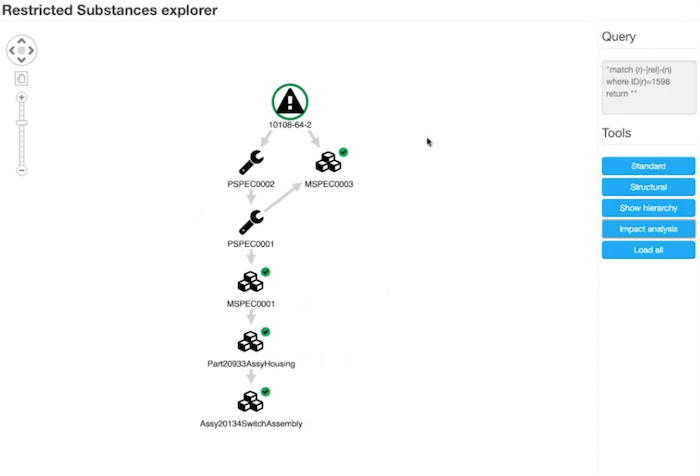
It starts to get overwhelming very quickly here, but if I pick that original material and carry out impact analysis, we can use the graph structure to tell us that.
Now we’ve hidden away anything that wasn’t downstream of that particular material. Ultimately, this tells me that if this material or this substance were to be banned, then these are the parts in my supply chain that will be affected. It’s affecting a particular process and a particular material that is used in a particular switch assembly. I’d be able to find out exactly how and why and how it impacts me.
This example is very small and simple, so the next question is: how does this scale?
[For more information about this example, see our blog post on Restricted substance compliance – a data visualization challenge?]
Using social network analysis methods
When you have a huge amount of data in a graph, you want to make use of the power of the graph to get answers to interesting questions.
There’s probably no point in visualizing the whole thing on one screen – it would be overwhelming and you wouldn’t know what to focus on. But if you ask the right questions, you can let the graph tell you about the things of interest.
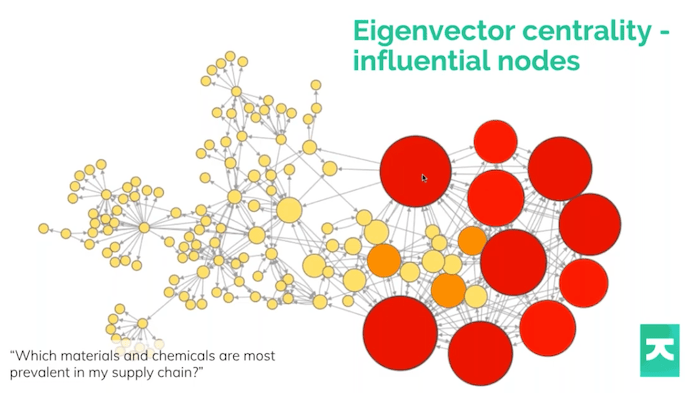
One very common thing that KeyLines lets you do is size or color your nodes by their importance. One measure of that importance might be how influential they are, and how many nodes a particular node connects to.
We use a social network analysis method called eigenvector centrality. It’s a fancy term, but it basically ranks nodes by how well connected they are, and how well connected their connections are. The more well connected they are, the higher the score. This helps you spot important things like what are the most important things to worry about, what materials do I depend on, and what materials do I use a lot of. If I’m starting from scratch trying to solve this problem, I can focus on the important stuff first.
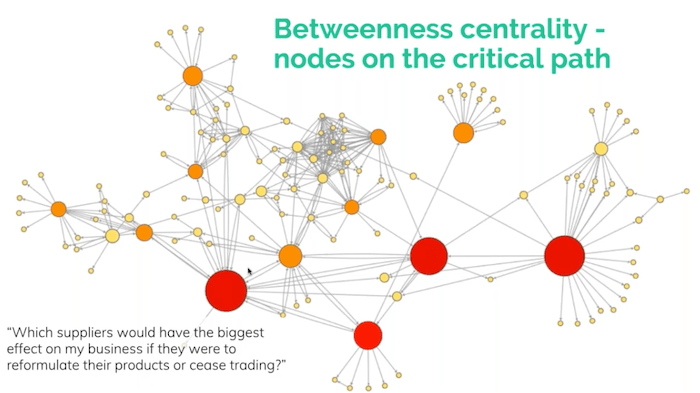
There are other measures too, such as betweenness. This is the same dataset, but I’m sizing the nodes by betweenness, which basically reveals the nodes that are on the critical path. If I took these nodes out of the network, what effect would that have on the network? It answers the question, which of these substances or suppliers would have the biggest effect if they were to cease trading or the chemical was banned?
Often, a supplier says, “I can’t use this chemical anymore, I’ll switch to a different one”. But they don’t tell their customers that they’ve changed it: they’ve changed their recipe. And downstream your product may not work the way it used to work. Maybe your flame retardants have changed and your car radios are suddenly more dangerous because they’re more flammable since your supplier changed that chemical. Which are the supplies that you depend on in the supply chain? Can I visualize them in a way that tells me where I should spend my effort and be more proactive about analyzing that risk?
Social network analysis & visualization
Here’s an old but fascinating true story.
Some years ago there was a fire in a chemical plant at a small town in Germany. It made a chemical which was used as a precursor to a certain plastic that was very important to the car industry. This was one of the only plastics that was strong enough, but also resistant enough to automotive chemicals, that could be used in car engines. And when this chemical was destroyed in the fire, the supply of this plastic plummeted and it affected automotive companies all over the world – the US, Japan – everywhere.
Figuring out that you have a node of such importance as this particular factory in your supply chain would have saved people an awful lot of downtime, and an awful lot of money. Finding these important nodes is a very valuable thing to do.
Now Christian is going to talk about a very different example in the world of liquor store data and inventory management.
Supply chain visualization: inventory management case study
This is a case that is near and dear to my heart. I’ll be focusing on logistics and inventory management – things that you may not immediately think about when you hear supply chain, but they are critical components of the overall graph.
In particular, we’re referring to the management of stock and product as its presented and delivered to customers or end users. You could say it’s one of the most important pieces of the supply chain: if there’s no customer to buy the goods, what’s the point of having a supply chain at all? I’ll introduce a couple of real world examples of cases where and inventory management has kind of gone wrong.
Back in 2015, Target opened about 130 branches of stores across Canada. And for a litany of issues and problems, they actually had to shut all of them at a great loss. There are great articles around about what actually happened, but a lot of them pinpoint issues around inventory management, in particular, the new system they brought in to manage the stock that was being sent to all the locations.
One particular problem was that they actually didn’t realize that half of the size measurements of stock were in inches, and half of them were in centimeters. It meant that store owners weren’t able to put stock on shelves, because it literally wouldn’t fit.
In the UK last year, a lot of KFC chicken shops had to shut down because of a chicken shortage. Failures in the transit of chickens to locations or the origin of that supply chain meant that real world stores had to close and people couldn’t get their chicken.
Visualizing the LCBO liquor store supply chain
I’m based in Toronto, Canada. My case study today focuses on the Liquor Control Board of Ontario (LCBO) which controls the sale of alcohol in Canada. The LCBO is the place you go to get alcohol: the vast majority of sales are through the LCBO and there are lots of stores around Ontario. It’s been important for nearly a century here – all alcohol sales are regulated – and the LCBO is one of the largest purchasers and distributors of alcohol in the world.
Thanks to the LCBO API put together by Carsten Nielsen, I can analyze and look at the data that underpins all of these stores, and all of the supply chain that brings the product to the stores. The LCBO dataset is a treasure trove of information about all the drinks sold. It’s definitely critical to have that data in the day-to-day running of the organization in particular for the supply chain.
As we saw with the Target example, the data quality is important. Using supply chain visualization is one way to keep track of the attributes and the trends of the product being sold in stores. I’ve taken that inventory data and I put it in KeyLines so that I can focus on some of the attributes that I thought were particularly interesting.
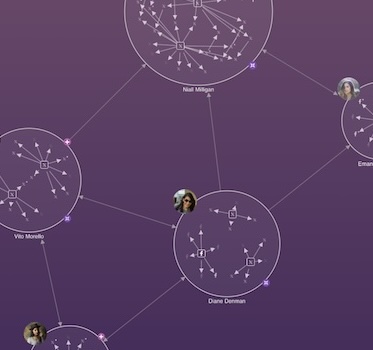
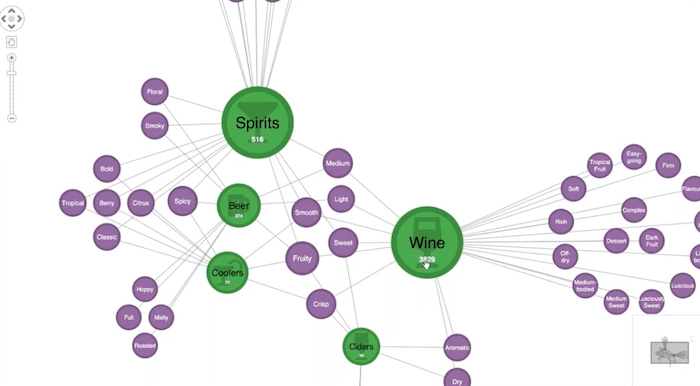
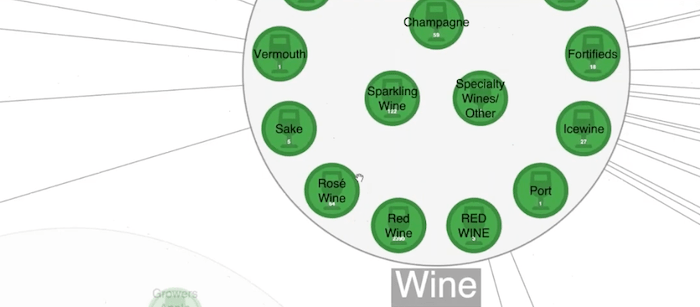
Here in green, I have the actual product. I’ve grouped those products by category. Whether it’s beer over here, ciders down here or wine over here, I’ve grouped them together as combos. The little numbers tell me the number of products inside each of these groupings of combos. As I’ve zoomed in, these purple nodes represent the tasting notes, and then link to different types of alcohol based on those tasting notes of the underlying product that is in each of these categories.
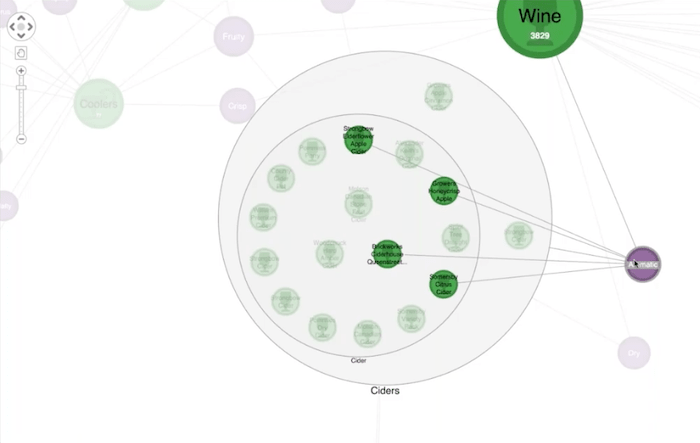
Now with KeyLines, I can zoom in and double-click on these combos to see the subcategories inside. I can see the actual ciders, then I can go down all the way down and see the actual brand of ciders shown right there at the bottom of this combo.
We have this nice nested grouping of those products. And by selecting one of my favorite ciders, I can see links back to the different tasting notes. I can spot other ciders or other types of alcohol that had the same notes. I go for aromatic here, I can see that there are other ciders with that same tasting note. In fact, there’s a whole bunch of wine that probably had that label as well.
This is a fun example, but it starts to give you some idea of spotting patterns in your data or your inventory that you may want to look at. For example, there are two ciders to the right of the combo that aren’t inside the cider subcategory combo?. Why is that? Are they being lost somewhere in the supply chain?
The same thing goes for inside this wine category where I see that there’s some capitalization. That’s a little odd. I see that red wine is in caps here and whereas it’s stored mostly in title case. This may be something I want to look into as well. Also, there are some nodes in the top right and it seems a little weird that these don’t have tasting notes. But if I zoom in, I see that actually, the LCBO does sell other products like bottles, product knowledge, videos, etc. It’s perfectly reasonable that these aren’t shown connected to anything in the chart.
[To discover more ways to customize data using KeyLines, see Styling a graph visualization]
Supply chain visualization as a map
They are the actual products being sold. What about getting these in front of customers in the stores? With KeyLines we can take the location of the stores contained in the data set, and we can put those, along with important statistics, directly onto the geospatial map. Here’s a map of Toronto, and here we see most of the stores as per the dataset shown in their actual real world locations around Toronto.
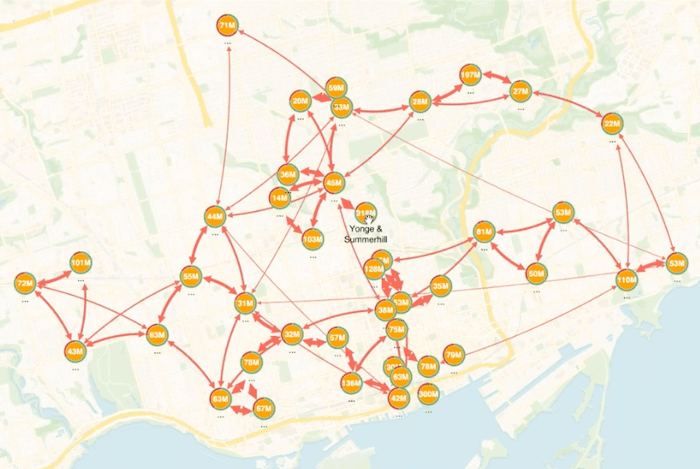
I put these little donuts around the nodes. These little donuts or pie charts represent the capacity of the store. For example, this store here on Avenue Road and St. Clair West, has about 50% capacity, which is maybe something to keep an eye on. Whereas another store has a much larger capacity and is mostly filled. The text on the node itself (here we have millions of dollars) is actually the amount of stock held at each of these locations. 318 is actually the largest number on the chart, and I could have resized the nodes to match that. What that shows is that Young and Summerhill is a very important LCBO, which it is as it’s a hub for the rest of the LCBOs around Toronto.
You can see the links here represent some sort of connection between these locations. These are actually algorithmically generated shortest paths between these locations that take into account the driving routes, as well as some other hazards that may exist be between locations. They’re a slightly abstract way of thinking about getting product between each of these locations.
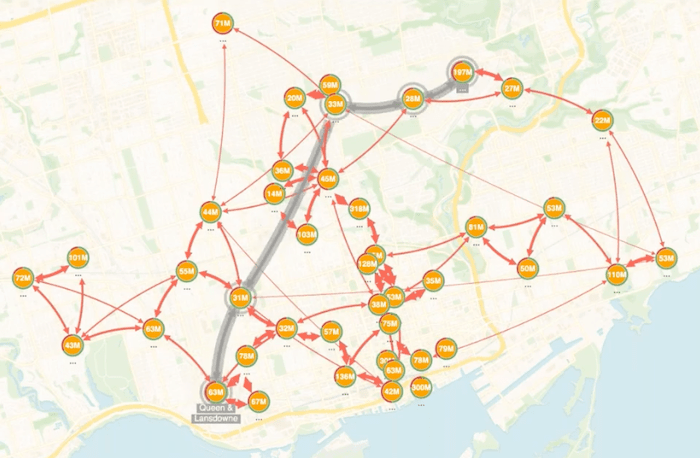
For a long time, graph visualization has been used to manage routing of transit between different locations. With KeyLines right here in the browser, I can run shortest path algorithms and determine the shortest path between two of these nodes on the screen. We like to use visual methods to highlight these in a particular way. If I select two nodes, we see the shortest path drawn in gray between them. It also takes into account the weighting of each of those links. Then we use our ping functionality to keep animating that so we can see it quite clearly against the rest of the chart.
These sorts of visualizations also useful for “what if?” analysis. For example, we can see what would happen if a particular store had to close. Maybe there was a weather event, which meant that they couldn’t pick up product from one store to take to another. It’s really helpful to visualize these so we can drill down in a way that makes sense to us.
[Want to use maps in your supply chain visualizations? See Geospatial graph visualization]
Supply chain visualization: stocklist analysis case study
With KeyLines, we often find ourselves drilling down further and further into a particular use case. The final thing I’m going to show you in this dataset is store-level analysis.
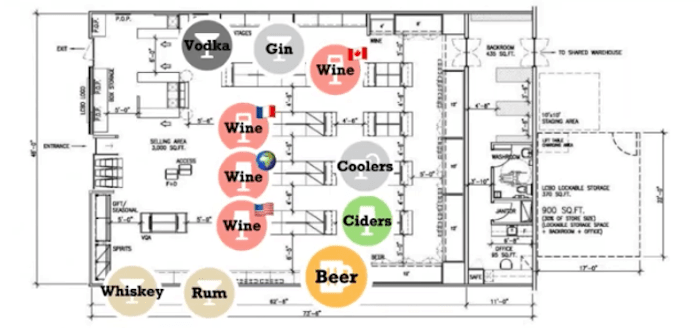
Here we’ve taken a store plan or a floor plan of a Toronto store, and we can see the stock as it’s located on the floor. I can zoom in and I can look at this with more clarity so I can spot the actual locations of the wine and where it’s from, and I can look at it in comparison with the rest of the floorplan.
Selecting a node means I can use our time bar at the bottom of the screen to look at the sales of that particular type of alcohol over time.
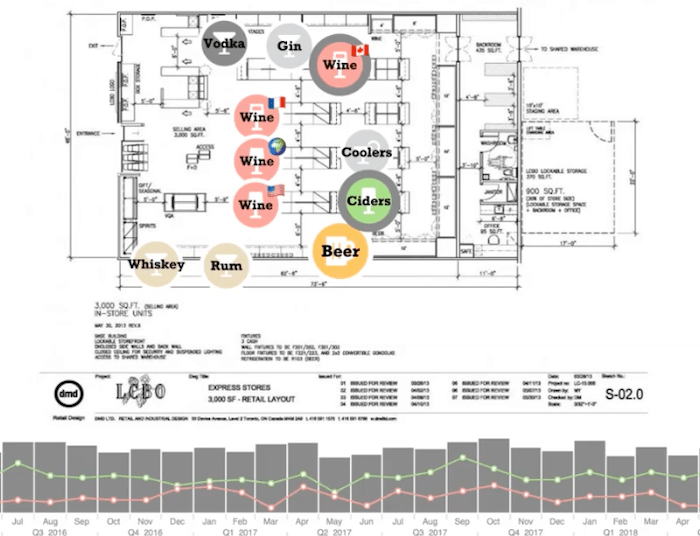
I can see that sales have been up and down over the course of the history of this branch. I can also select another node here to compare the two. If I want to compare Ontario wines versus cider, then I could do that here quite easily with the comparison trendline on the time bar.
You may be questioning whether this is really a graph, right? They’re just nodes, there are no links.
I didn’t really have any data that I could put on this view. But in reality, the LCBO is likely to have information regarding customers and the way in which they traverse stores, as well as the planning around marketing for particular liquor items as they become more or less popular, depending on the time of year. One way to take this demo further would be to put a heat map on the background, and then have a visual way of saying “I want to move this stock to a different location, and match the customers that are coming into the store”.
[Find out how to create heatmaps directly from your data using KronoGraph, our timeline visualization toolkit.]
Supply chain visualization Q&A
How do I pull data from multiple different data sources on the same view or the same supply chain visualization?
In the case I was talking about, it’s very unlikely you’ll have all the data in one place.
A lot of projects these days do extraction, transformation and loading (ETL) – so big, large scale transformations and movement of data to solve various use cases. I think it’s a perfect use case for graph technology to build a graph database to extract the data from the various databases where it is, put it into a graph database, and then do exactly the kind of thing I showed. If you want to though, KeyLines runs in the browser, and in many use cases, that data hasn’t been put together until the moment it appears in the browser.
We often use a technique called enrichment where you visualize one database – for example, our chemical use case – and then right-click on one of those chemicals and say okay, now go out to a completely different database and get me a factsheet about that chemical. I can access its safety data sheet or its chemical formula from within the visualization. There are different techniques for doing it. Not saying it’s easy, because this data is in a lot of different places, but the technology is out there and KeyLines works very well with data from disparate sources.
How much supply chain data can you put on the screen at once?
KeyLines has a WebGL renderer, which means you can get a lot of data on the screen at once. It’s not unusual to see tens of thousands of nodes represented on the screen at once, right here in the browser.
But often, it’s the case that you don’t really want to put that much data on the screen at once, using some of the techniques I’ve shown today. Like the combos in that original chart I showed: many thousands of nodes underpinning the relatively small amount of nodes that was shown at the end. Combos are a great example of working with large volumes without having to show it all on the screen at once.
Another great example is using the time bar filtering Dan showed today, as well as graph analysis algorithms like the shortest path so you can just highlight and focus on things that are particularly interesting.
[For more details on managing the data in your charts, see Five steps to tackle big graph data visualization]
Where is the place for graph analytics in risk management?
That’s an interesting one and we’ve covered some of that today. The graph algorithms or the analytics that we’ve shown you with betweenness and eigenvector centrality are interesting techniques that aren’t really that apparent if you’re using traditional dashboarding or some sort of analysis tools.
There are two situations.
There’s the kind of reactive stuff where, when a new chemical gets added, we want to say “how does that impact us?” I showed an example of that where having the data in a graph means I can just explore outwards from something and learn more about it.
Then there’s the proactive approach where you are using a graph on a large scale to say, “where is the most important stuff that I need to be spending my time on?”. And if your supply chain is made up of 30,000 parts and goodness knows how many chemicals, then you’re going to need all the help you can get to figure out where you should be spending your time. Graph analytics can be fantastic at just telling you where the interesting stuff is in a sea of not-so-interesting stuff.
Does KeyLines only work with Neo4j?
KeyLines can work with Neo4j as well as pretty much any sort of data source. In fact, my demo today wasn’t using a database at all, it was just using flat files on disk or just using the JSON, feeding into KeyLines. And you could also query a REST endpoint or GraphQL endpoint so you can get data into KeyLines.
We have demos on our SDK site for all of the popular graph databases, such as CosmosDB, Amazon Neptune, OrientDB, ArangoDB, and so on. But really, we don’t lock ourselves into any sort of particular database, nor do you have to be using a graph database.
A lot of our customers are using more traditional relational databases, or even search indexes like Elasticsearch.
[For more details, take a look at our Integrations blog posts]
How do I get hold of the data you’ve shown today?
We’re happy to share any of the source data – just drop us a line. The chemicals data is available from the European Chemical Agency website.
Where do you stand on network discovery, i.e., situations where you do not know which supply chain nodes connect to other nodes for entire networks?
We do have customers doing network discovery, not in supply chain necessarily, but understanding IT networks and figuring that stuff out. Obviously, where we stand is at the visualization end: we’re helping you draw an intuitive picture. That network discovery could happen first and then you visualize the final results using KeyLines. KeyLines could also help you understand what you don’t know – we can quite effectively give visual cues like dotted lines or grayed out nodes or links in a diagram to help people understand what’s known and what’s not.
[Read more about IT network infrastructure visualization]
In the earlier example I showed, some of those materials had little green checkmarks on them, which was illustrating that we had a full supplier disclosure for those. It meant we know everything that’s in the material. So again, it’s very, very important if you’re an analyst in the environmental health and safety world to know what you don’t know.
Having visual cues that tell you “this materials declaration is incomplete”, or “this materials declaration is out of date and hasn’t been renewed for two months” is really important. Little visual cues to help people understand what you don’t know is something we can do. Obviously, we can’t help actually doing the discovery, but visualizations can help with a product that does that kind of thing.
Feel free to email us – we’ll be happy to answer any questions. Thank you very much!