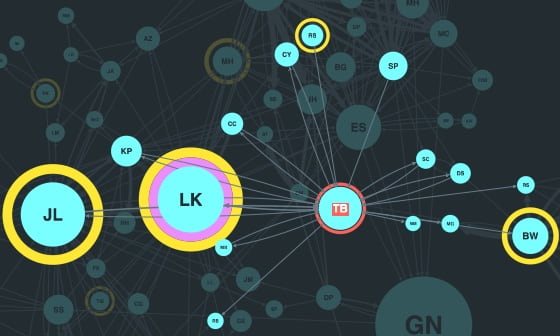
KeyLines and ReGraph are a database agnostic network visualization tool. This means it is compatible with any datastore you want to use, and NoSQL visualization is a popular choice.
What is NoSQL?
NoSQL (sometimes also called ‘Not Only SQL’) is a collection of database categories based with non-relational models.
These systems offer excellent scalability, performance and flexibility, as well as simpler maintenance and cheaper hardware requirements. As a result, they’re popular options for enterprise-level ‘big data’ and network visualization.
Graph visualization with any datastore
To learn more about graph visualization and how to visualize your complex connected data, download our ultimate guide to graph visualization
Categories of NoSQL Database
The NoSQL data models broadly fall into three categories:
Key value / Column Stores
The most basic NoSQL data model, with each item stored as a name (or key) with a value, ideal for non-complex data. Examples include CouchBase, DynamoDB, Cassandra and HBase.
Document Stores
Data is stored as flexible objects known as documents, ideal when richer or semi-structured data is being stored. Examples include CouchDB and MongoDB.
Graph Stores
Data is stored in a connected format, ideal when connections are an integral component of the data. Examples include Neo4j, Amazon Neptune and Microsoft Azure Cosmos DB.
How to visualize your graph data
At Cambridge Intelligence, we help developers build graph visualization tools that are 100% customized to their users, their data and the questions they need to answer.
Graph visualization for JavaScript developers
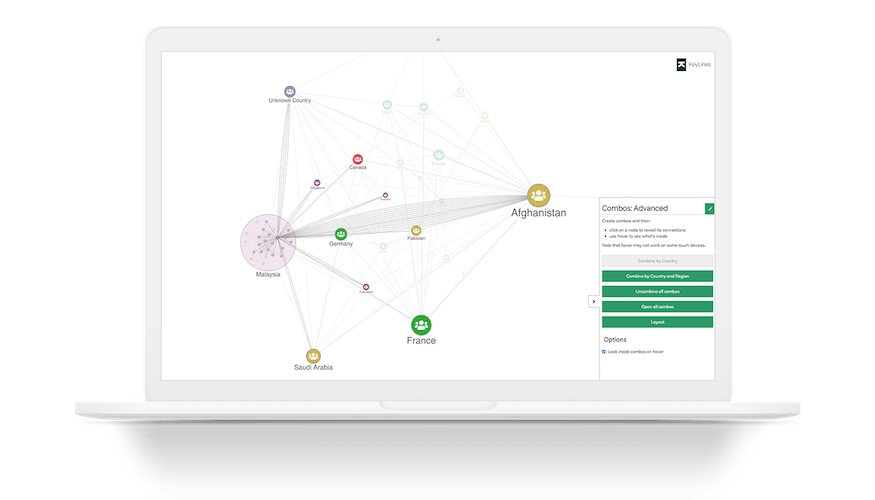
Code how you like. Add graph visualization to your applications that works anywhere, as part of any stack.
Graph visualization for React developers
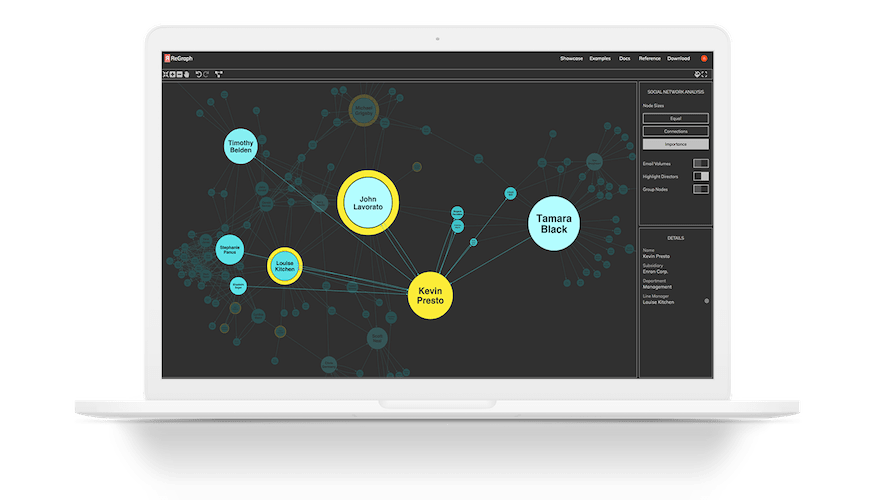
With ReGraph’s simple data-driven API, it’s quick and easy to add graph visualizations to your React applications.